Background
The optimal energy mix in Australia has been vigorously debated in Parliament late this year, delivering vastly different proposals. Labor proposes a heavy reliance on renewables, and the coalition proposes a combination of fossil fuels eventually augmented with seven nuclear plants scattered around five states. Another, closely related, ongoing debate concerns whether Australia is on track to meet its 2030 greenhouse gas emissions reduction target, and if not, how best to meet this target. Both debates reflect the concerns of Parents for Climate and The Climate Council that climate change is driving up the cost of insurance, and thus cost of living, pressing concerns for most Australian families.
Central to both debates has been the (properly measured) cost of alternative combinations of renewables, fossil fuels, and nuclear. Alternative costs are relevant not only for guiding investment and emissions reduction strategies, but also for their impacts on household budgets during what is being called a cost of living crisis.
Part I Renewable Energy
The International Renewable Energy Agency (IRENA) has documented a 93% decline since 2010 in the cost of electricity in Australia. In addition, costs of electricity battery storage projects have declined 89% since 2010.
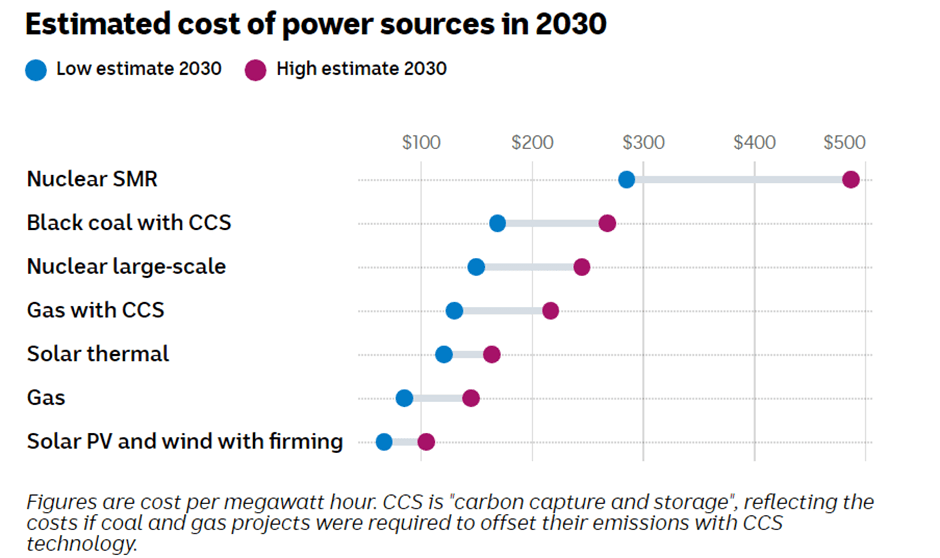
Since 2018, the Australian Commonwealth Scientific and Industrial Research Organisation (CSIRO) and the Australian Energy Market Operator (AEMO) have been collaborating annually to update the costs of new-build electricity generation, storage and hydrogen production, projected to 2050. They find the cost range for variable renewables (solar PV and wind) with integration costs is the lowest of all new‐build technologies in 2023 and 2030. The cost range overlaps with the lower end of the cost range for coal and gas generation, even when the negative externalities associated with coal and gas with carbon capture are not accounted for. They also predict that advances in technology will cause the cost of solar PV and wind to continue declining and maintain their cost advantage through 2030. Nuclear small reactors (SMR) costs are predicted to improve significantly by 2030 but remain significantly higher cost than these other alternatives. They find nuclear power to be more expensive than renewables and the long development time would preclude it from making a meaningful contribution to achieving net zero emissions by 2050. Neither type of nuclear generation can be operational by 2030. Cost ranges for alternative energy sources are illustrated in Figure 1 and Figure 2.

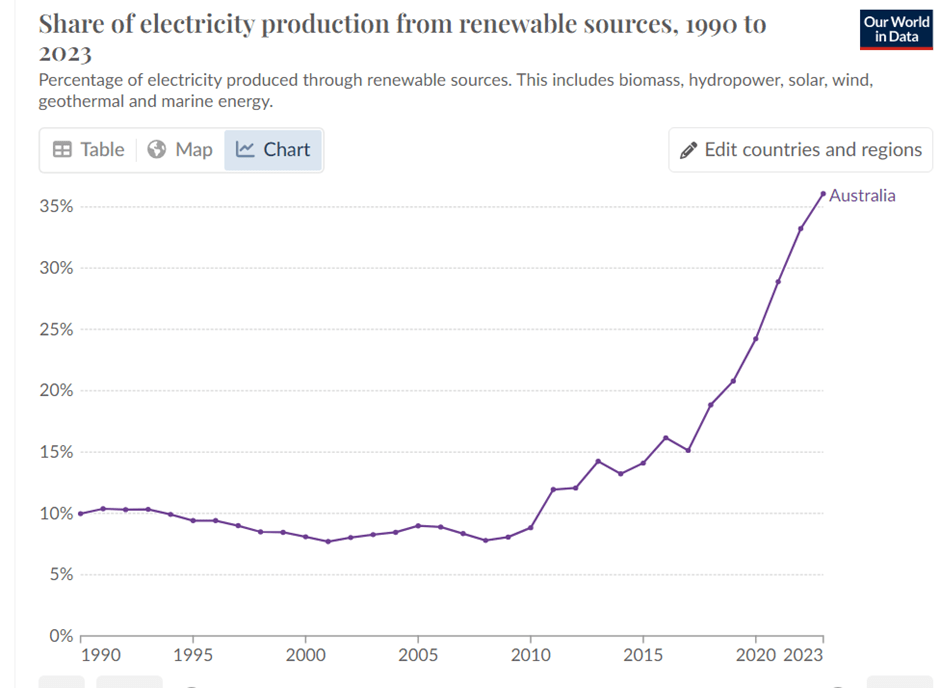
The cost advantage enjoyed by renewables has ensured that its usage is increasing. The renewable share of energy consumption has tripled since 2010. This technology-driven cost advantage has also ensured that the share of electricity production from renewables has increased nearly five-fold since 2010. See Figure 3 and Figure 4.

The continuing growth in renewable energy, and electricity in particular, has a significant consequence for households. Residential electricity prices are predicted by the Australian Energy Market Commission (AEMC) to fall by about 13% over the next 10 years. Households that switch from gas to electric appliances, install rooftop solar, purchase an electric vehicle and charge it during the day when electricity is cheaper, may reduce their energy expenditure by more than 70%. Not every household can afford to switch. Inequality and poverty are persistent constraints to reaping the economic benefits of technological change in renewable energy generation.
It follows that since renewable energy prices are declining, and its usage is increasing, it must be exerting downward pressure on the cost of living for the vast majority of Australian households.
Part II The Cost of Living
A recent article in the Australian Financial Review summarised the issue succinctly, noting that “[T]he cost-of-living crisis in Australia is not only because inflation is high but because inflation is higher than the growth in nominal incomes, in which case real incomes are falling”. The “crisis” is akin to a two-sided coin, with household living costs on one side and household incomes on the other.
Fact #1 Household living costs have increased since 2020. The consumer price index (CPI) has increased by 20%.
Overall Inflation
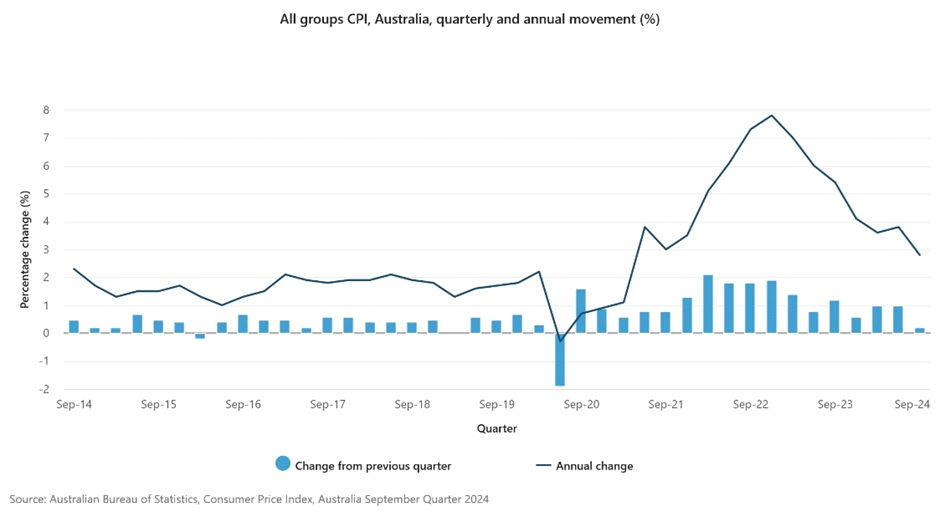
Price levels as measured by the Australian Bureau of Statistics (ABS) consumer price index have increased every quarter from September 2020 through September 2024. During this period annual rates of inflation increased during the pandemic, reaching a peak of 7.8% in late 2022 before declining to a low of 2.8% recently. As a result, consumer prices are currently 20% higher than they were four years ago, as Figure 5 illustrates.
Fact #2 Prices of alternative goods and services have changed at different rates. Consequently, some households have experienced larger increases in living costs than other households.
Inflation for Alternative Commodity Groups
In 2024 prices of alcohol & tobacco, health, education, and insurance & financial services have increased by more than the CPI. Prices of clothing & footwear, furnishings, household equipment & services, and communications have increased by less than the CPI. Figure 6 illustrates the impact of inflation on alternative household consumption categories. Consumers of alcohol & tobacco and insurance & financial services, and parents of school-age children, have been particularly hard hit.

Fact #3 Alternative household types consume different goods and services, and so face different living cost increases.
Inflation for Alternative Household Types
During 2024 employees, the largest of the five household types defined by the ABS, and other government transfer recipients, have been most affected by price increases, and self-funded retirees have been least affected, as Figure 7 illustrates.
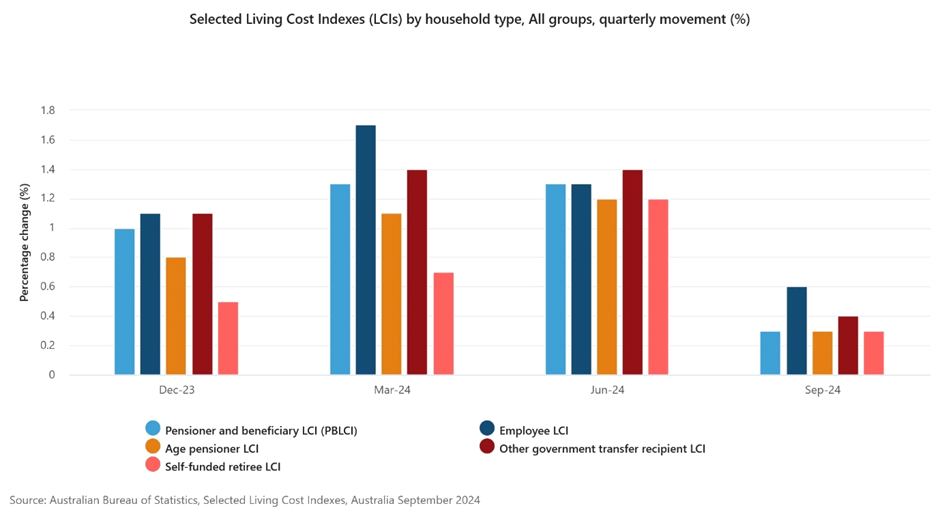
The main contributors to living cost increases, and their rates of inflation, for each household type are listed in Table 1. Insurance & financial services indexes have risen significantly in September 2024 for all household types, ranging from +14.8% to +17.4%. This result is consistent with the claim of Parents for Climate and The Climate Council that climate change is driving up the cost of insurance, and thus cost of living.
| Household type | Main annual contributors |
| Pensioner & beneficiary | Insurance & financial services (+15.9%), Housing (+3.4%), Food & non-alcoholic beverages (+3.3%), Alcohol & tobacco (+8.6%) |
| Employee | Insurance & financial services (+17.4%), Food & non-alcoholic beverages (+3.3%), Alcohol & tobacco (+6.4%), Health (+4.9%) |
| Age pensioner | Insurance & financial services (+14.8%), Food & non-alcoholic beverages (+3.3%), Health (+5.0%), Housing (+2.9%) |
| Other government transfer recipient | Insurance & financial services (+16.8%), Housing (+4.1%), Alcohol & tobacco (+9.5%), Food & non-alcoholic beverages (+3.3%) |
| Self-funded retiree | Insurance & financial services (+14.9%), Health (+5.1%), Food & non-alcoholic beverages (+3.2%), Alcohol & tobacco (+5.3%) |
Inflation in Household Energy Usage
In Figure 6 inflation in household cost exceeded overall inflation, and then began declining to levels less than overall inflation. This has reflected high and stable rates of inflation in rents and new dwelling purchases, stable and low rates of inflation in gas and other household fuels, increasingly offset by negative and declining rates of inflation in household electricity consumption. Electricity prices fell 35% in the year through October 2024, as illustrated in Figure 8.
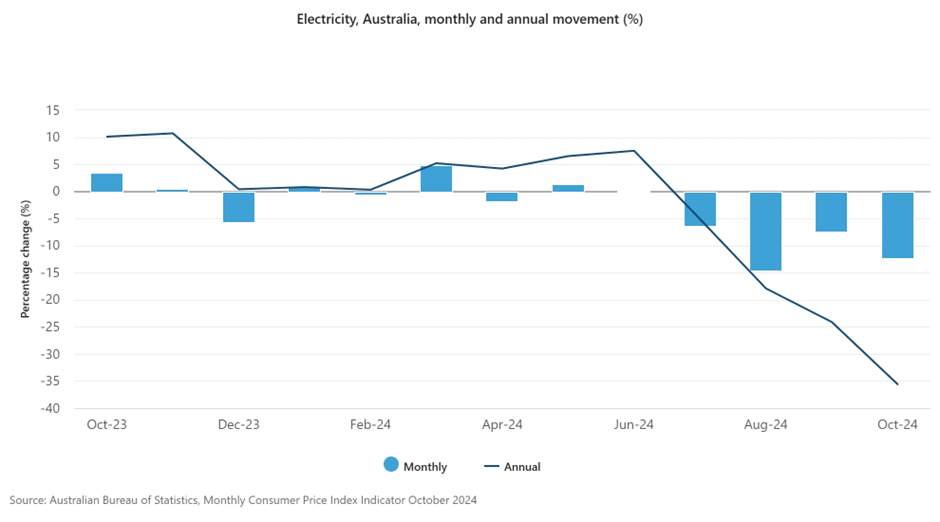
Since renewable resource use is increasing and renewable prices are falling, and electricity accounts for a growing share of renewable energy usage, declining household electricity costs are an inevitable outcome, offsetting other drivers of increasing living costs.
Part III Income
A comprehensive index of household income does not appear to be reported by ABS. Fortunately, it does report an index of wage income, the wage price index (WPI). Since employees constitute the predominant household type, and wage income comprises over 80% of household income, WPI provides an informative comparison with the household consumer price index CPI explored in Part II.
During the decade prior to 2020 wage growth slowed from an annual rate of 3.5% to less than 1.5%. Since 2020 the annual rate of wage growth has increased to a peak of over 4%, declining recently to 3.5%, as Figure 9 illustrates. This trend cumulates to an increase in WPI of 25% since 2020. Wage growth trends are similar for private and public sectors.

Fact #4 Employee wages have increased since 2020. The wage price index has increased by 25%.
Part IV Real Income and the Crisis
The data constraint makes it difficult to combine both sides of the proverbial coin to examine trends in household real income, income adjusted for inflation.
Over the past four years, household living costs have increased by 20% and employee wage income has increased by 25%. Households headed by employees earning wage income have incurred the largest increase in living costs of 25%. Other household types have incurred living cost increases between 19% for self-funded retirees and 21% for other government transfer recipients. This suggests that the real incomes of most households, far from declining to crisis levels, have increased.
Part V The Cost of Living Crisis
Over the past four years household living costs have increased, by anywhere between 19% and 25%, depending on household type and their consumption decisions. Foremost among the drivers have been insurance & financial services, and education. Electricity consumption is included within the housing category in Figure 6, and is responsible for much of housing’s downward trend during 2024. During the same period employee wage income has increased by 25%. This suggests that employee households earning wages have broken even since 2020, and all other household types (with their relatively smaller cost of living increases) have experienced an increase in their real incomes. All household types can thank the renewable resources sector of the economy for depressing living costs during this period, and in all likelihood for continuing to exert downward pressure on living costs for the foreseeable future.
This is a joint blog by J E Lovell and C A K Lovell inspired by recent Parliamentary debates on the optimal energy mix in Australia.